Monitoring
These pages are for day to day reliability checks and troubleshooting. They are safe to use without SSH access.
Queues
Queues
Queue status and backlog counts.
| Queue | Waiting | Active | Delayed | Failed | Status |
|---|---|---|---|---|---|
| transcribe | 0 | 0 | 0 | 0 | OK |
| genQuestions | 2 | 1 | 0 | 0 | OK |
| analyze | 0 | 0 | 3 | 0 | OK |
| extractText | 0 | 0 | 0 | 2 | Failed jobs |
| publish | 1 | 0 | 0 | 0 | OK |
| pdfStandardizer | 0 | 0 | 0 | 0 | OK |
| videoCaptions | 0 | 0 | 0 | 1 | Failed jobs |
| export | 0 | 0 | 0 | 0 | OK |
- Queue list: shows backlog counts (waiting, active, delayed, failed)
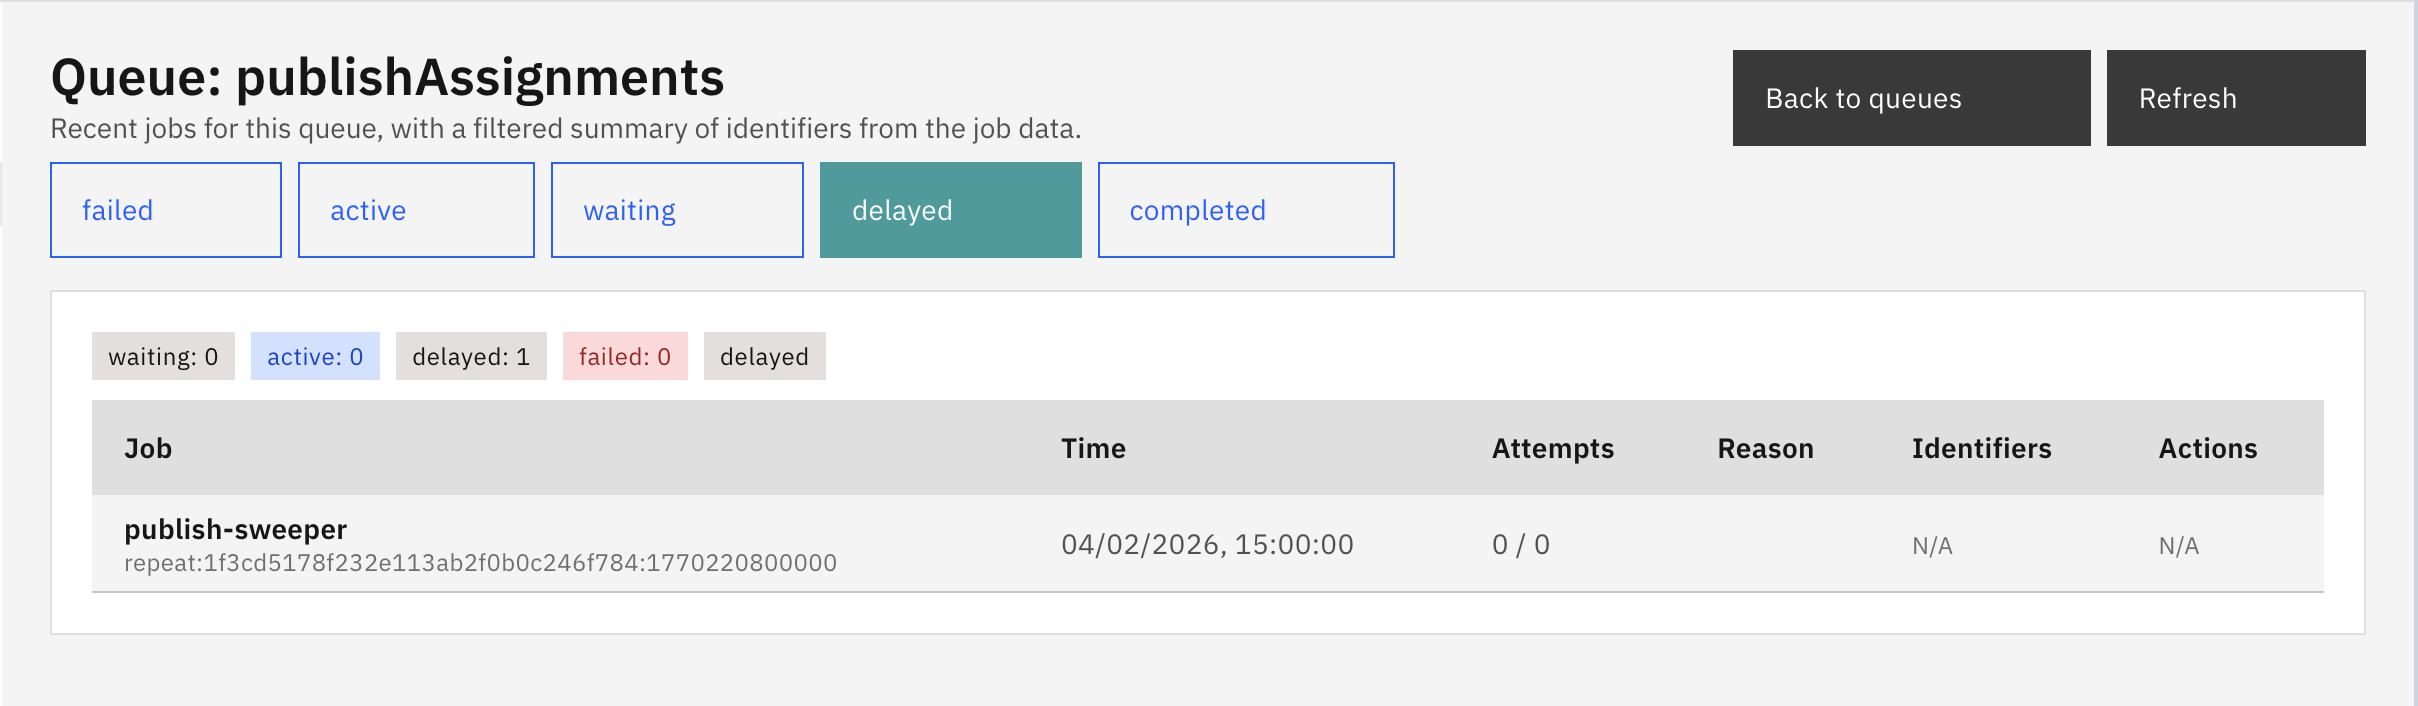
- Drill-down: shows recent jobs by status, with safe metadata and failure reasons
- Actions: failed jobs can be retried or removed. These actions are recorded in audit logs.
Workers
Workers
Background worker status based on database heartbeats.
| Status | Last seen | Instance | PID | Workers | Release |
|---|---|---|---|---|---|
| OK | 04/02/2026, 15:42:18(12s ago) | ip-10-0-1-42 wrk_a1b2c3d4e5f6 | 1842 | transcribe,analyze,genQuestions | v2.4.1 |
| OK | 04/02/2026, 15:42:15(15s ago) | ip-10-0-1-43 wrk_g7h8i9j0k1l2 | 2156 | publish,export,extractText | v2.4.1 |
| Stale | 04/02/2026, 15:38:42(228s ago) | ip-10-0-1-44 wrk_m3n4o5p6q7r8 | 1523 | pdfStandardizer,videoCaptions | v2.4.0 |
Worker status is based on a database heartbeat (not process manager output). If workers are stale, background processing is not healthy.
Incidents
- Incidents: capture of important failures (for example, failed LTI launch or worker bootstrap failure)
- Acknowledge: marks an incident as reviewed so it no longer shows as unacknowledged
The incidents page displays a table of operational failures with severity levels (INFO, WARNING, ERROR, CRITICAL). Each incident includes a timestamp, message, and metadata. Administrators can acknowledge incidents to clear them from the unacknowledged count shown on the Overview page. Clicking on an incident row opens a details modal with the full error context and stack trace when available.
Comments
Leave a comment, question, or feedback. Comments are public — please don’t include personal data.